MassCEC’s whole-home air-source heat pump pilot program has been running for about four months now. This blog is part of our commitment to provide monthly updates on the pilot. The goal of these updates is to share results along the way and get input as we go. See our launch posting and our one month, two month, and three month updates for more information.
Our big news this month is that we’ve decided to extend the pilot until June 30, 2020. That means that we’ll continue to accept new applications through the first half of next year as long as we still have budget remaining. The maximum budget for the pilot is still $500,000, which should support between 100 and 200 whole-home projects. Installer Resource Page
We currently have 22 applications (13 existing building retrofits and 9 new construction or gut rehab projects). One highlight from this month is that we had our first VRF style system for this pilot! The whole-home pilot now has participating installers from 29 companies based in 11 of Massachusetts’ 14 counties.
A Few Notes on Heat Load Calculation
As part of our program, we require air-source heat pump installers to submit a Manual J peak heat load calculation. Our goal is to encourage appropriate sizing to reduce cycling. Even though these are whole-home systems, the heat load calculations don’t require padding (i.e., no need to pick a colder design city), because Manual J already has a safety factor built in.
In MassCEC’s review of the heat load calculation, the first thing that we look at is how the overall heat load compares to the total capacity of the selected heat pumps, but we also do a room by room comparison, so it’s important for us to have the room by room calculations. If the overall system is oversized, this room by room analysis helps identify places that indoor units can be downsized in order to downsize the outdoor units.
A lot of assumptions go into a Manual J: air leakage, areas, orientation, shaded areas, wall R-values, window U-values, solar heat gain, etc. The input values for these assumptions really matter. The technical consultant for this pilot, Bruce Harley, has reviewed some of the Manual J’s more in depth, and he’s noticed some incorrect assumptions on windows or walls that can increase the heat load by up to 40%. For installers, one way to gut check the output of your Manual J is by looking at the relative breakdown of the sources of heat loss.
We’ve had a few cases in the pilot where the Manual J was done by a third party like a HERS Rater, mechanical engineer, or energy consultant. This is certainly not industry standard practice, but it’s an option. At MassCEC’s recent Start Smart training for new construction, Tim Gould of ACE Energy Services says that he recommends that new home builders hire a third party for the heat load calculation to enable them to feel confident in the heat load calculation and get multiple installation bids.
New Construction Has Lower Loads
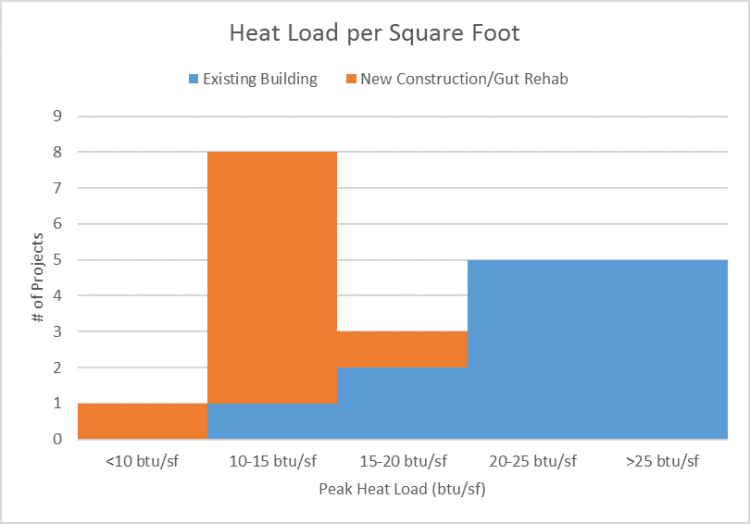
This won’t surprise anyone, but I think it’s still worth saying: we are in fact finding that the new homes participating in our pilot have lower heating loads per square foot. For new construction, the average peak heat load for our pilot homes is 12 btu/sf, while for the existing home retrofits the average peak heat load for our pilot homes is 23 btu/sf. The graph in this post shows the spread that we’ve seen so far. I want to note that this is still a tiny data set and I’ve talked above about some of the imperfections in Manual J heat load calculations, so there are limitations to the data.
Lower heat load per square foot translates into lower project costs. So far we’ve seen a similar cost per ton for retrofit and new construction, but the average total project costs for whole-home retrofit projects is $22,800 versus $12,500 for new construction.
Feel free to email me if you have any questions or comments about the pilot.